Backtest · 2020 → 2026
Adaptive deployment vs fixed DCA. Six years of weekly BTC data.
329 weeks · January 2020 to April 2026 · One variable: how much to buy each week.
Phoenix CAGR
20% – 150%
Bear to Bull scenario
Total Return
Depends on capital
And time window
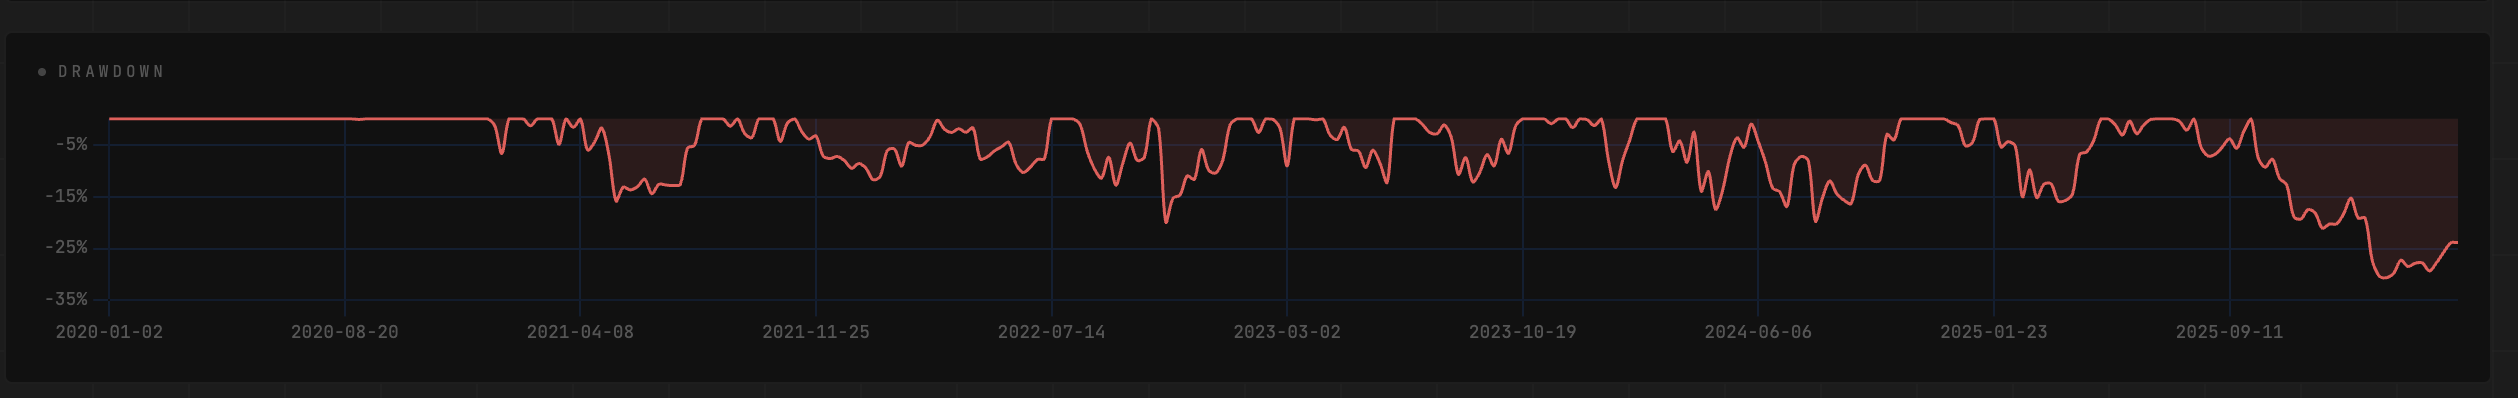
Max Drawdown
-20% to -30%
Controlled by sell signals
Sharpe Ratio
0.5 – 2.4
Depends on market scenario
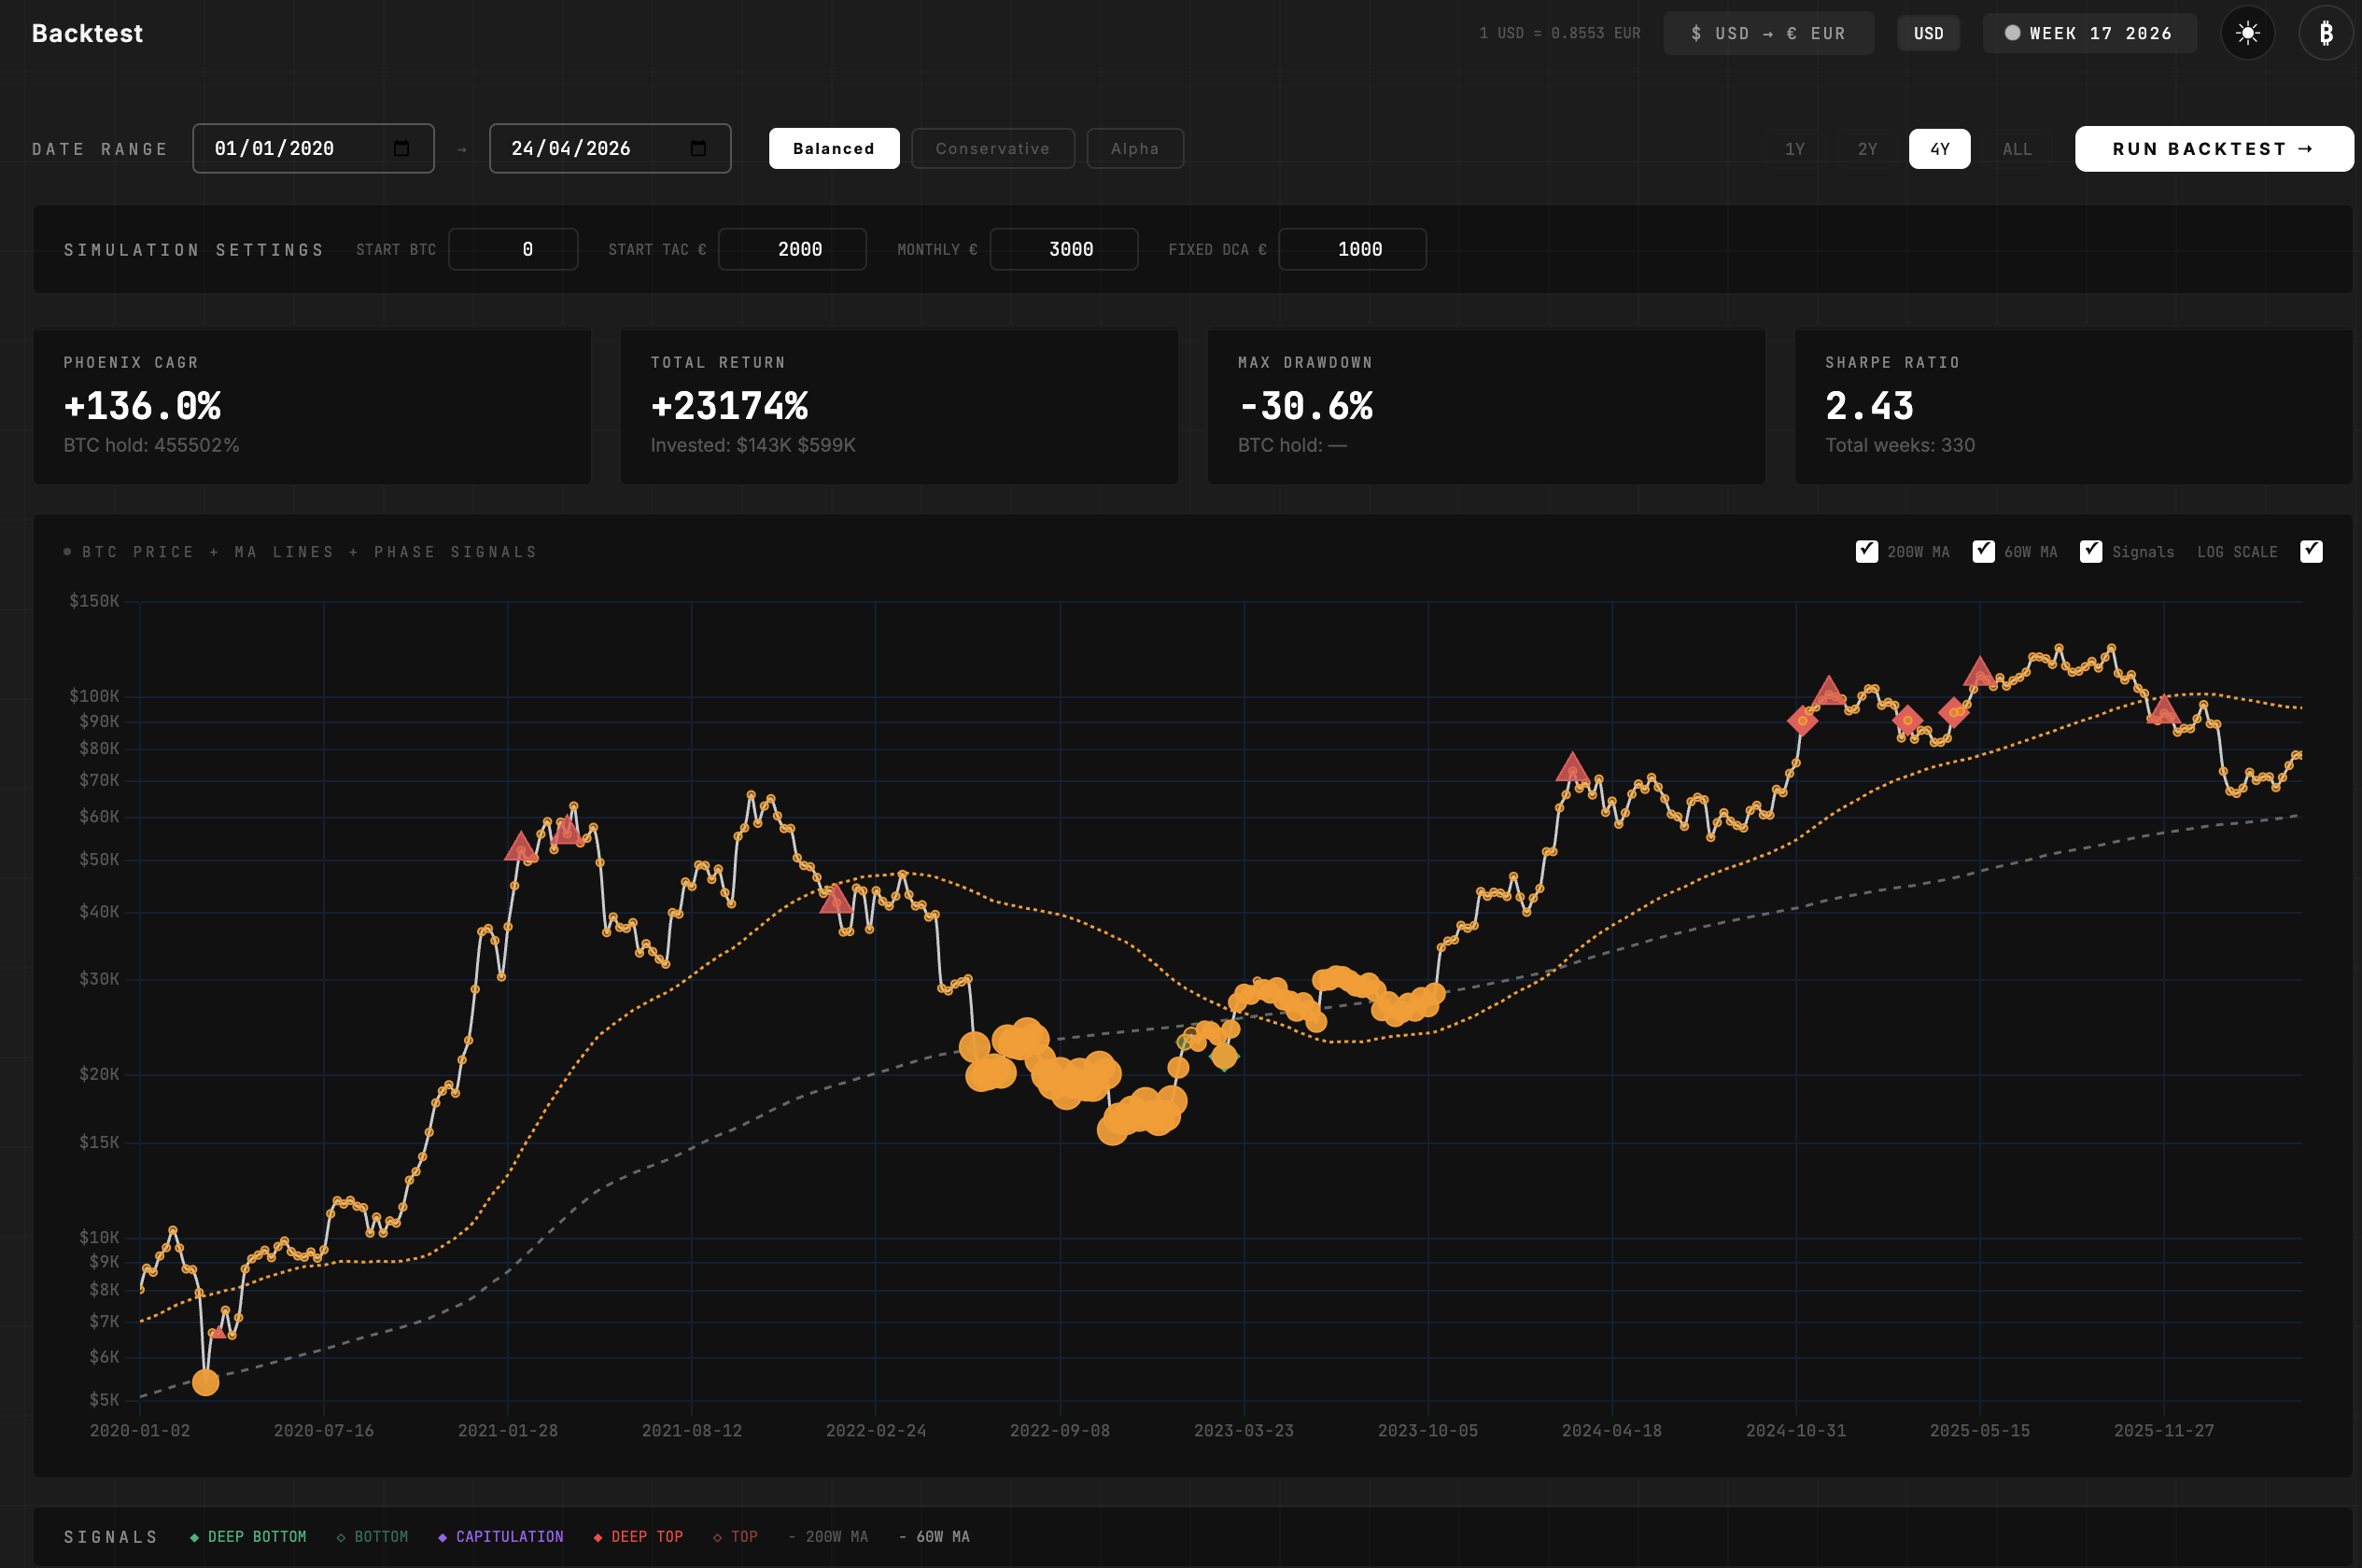
BTC Price + MA Lines + Phase Signals
Drawdown
Why the system sells — and where the capital goes
The system does not time the market. The objective is one thing: accumulate more BTC per dollar or euro deployed across a full cycle than a fixed weekly buy would achieve.
When multiple signals simultaneously reach historically stretched levels, a partial reduction of up to 30% of the BTC position is triggered. This is a mechanical response, not a discretionary call. The proceeds move into the Tactical Reserve and Crash Reserve, held specifically to redeploy at lower prices during the next contraction.
The result is a structural advantage: capital is preserved near cycle highs and deployed more aggressively near cycle lows. The red triangles on the chart mark every trigger point in the backtest. Each was followed by a period of lower prices where the reserves bought back in. The goal throughout is a larger BTC stack at the end of the cycle, not a prediction about price direction.
Performance by scenario
BTC Buy executions
Every orange dot marks a weekly buy. Larger clusters indicate elevated tactical or crash reserve deployment during signal extremes. The 2022 bear market cluster is the most visible example. That is where the system deployed most aggressively while most accumulators stopped buying entirely.
Sell signal triggers
Red triangles mark partial sell events. Up to 30% of the stack is liquidated at these points and redirected to reserves. They cluster at cycle tops, 2021 and late 2024 into 2025. Each trigger is mechanical, not discretionary. The system does not predict tops. It responds to measured valuation extremes.
Moving average context
The orange dashed line is the 60-week moving average. The grey dashed line is the 200-week moving average. The 200W MA is Bitcoin's long-cycle floor reference. Price trading below it has historically marked the most significant accumulation windows in Bitcoin's history.
Backtest period: January 2020 to April 2026. 329 weeks of real BTC price data. Results shown are simulated and based on historical signal behaviour. Past performance does not guarantee future results. CAGR, drawdown, and Sharpe ratio ranges reflect Bear, Base, and Bull market scenarios using 20%, 55%, and 110% annual BTC growth assumptions respectively. Actual results will vary based on investment profile, capital deployed, reserve configuration, and market conditions. This page is for informational purposes only and does not constitute financial advice.